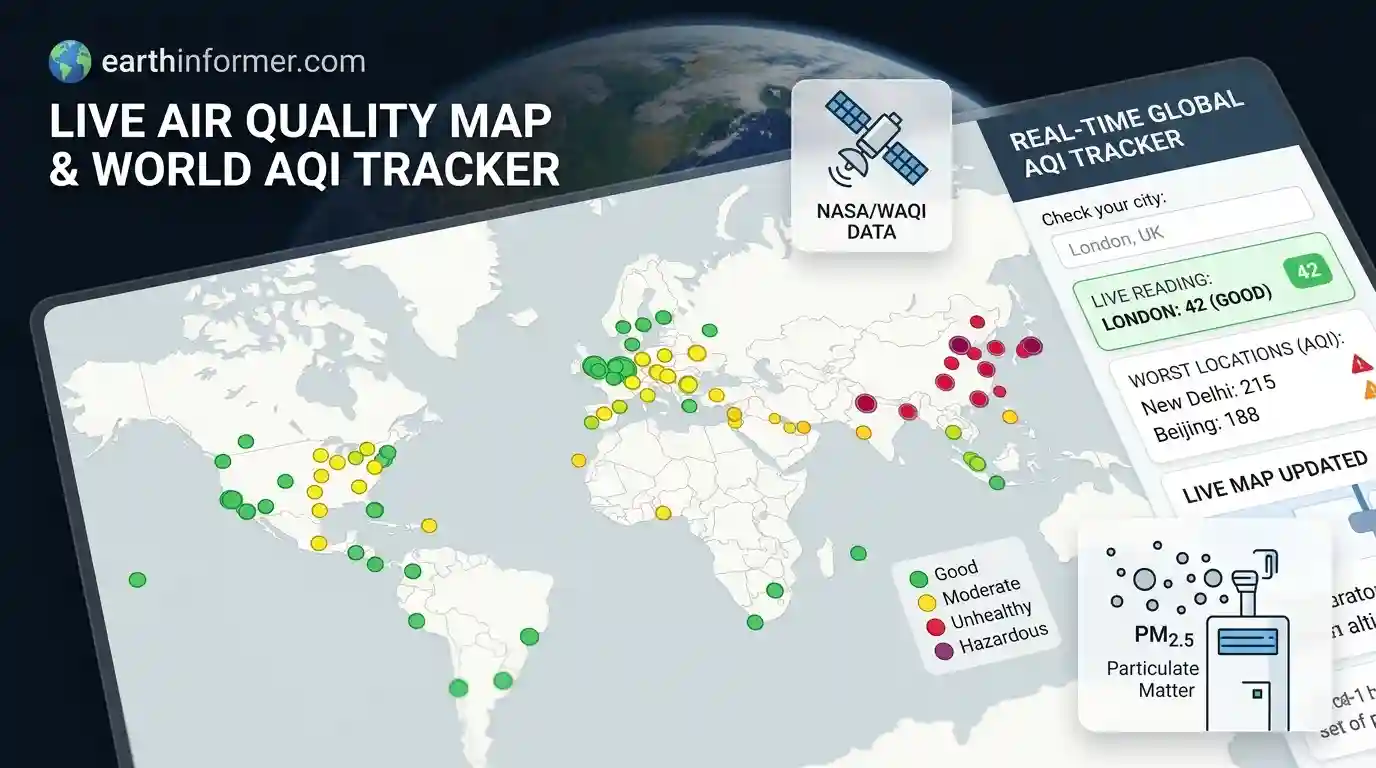
Track real-time global air quality, PM2.5 pollution levels, and smog distribution. Interactive live map updated every 15 minutes with official station readings worldwide.
Data source: World Air Quality Index Project (WAQI / aqicn.org) aggregated from official government monitoring stations worldwide (EPA, EEA, etc.). Updated every 15 minutes. For local health advisories, follow guidance from your local environmental protection agency.
What This Air Quality Map Shows
This page shows real-time air quality levels around the world on a live map. The data comes from official government monitoring stations and satellite measurements that detect pollution and smog on the ground. Each dot is a monitoring station, and the color shows the Air Quality Index (AQI) severity. The list next to the map ranks stations by their pollution levels or groups them by region. Use the view menu to jump to a continent, filter stations by unhealthy or hazardous levels, or turn on the layer focusing on poor air quality zones.
Is the Air Quality Bad Near Me?
Press “Poor Quality Only” or allow location access if prompted to check your local area. The map highlights stations in your region, and the list shows the closest monitoring points with live AQI numbers. If an area has no data points, no official monitoring stations are reporting in that immediate zone. High pollution levels often show up during wildfires, industrial smog events, or stagnant weather patterns. This map is not a medical tool. If you have respiratory issues, follow guidance from your local health authority.
How Air Pollution Affects Global Health
Air pollution impacts billions of people every year. Fine particulate matter, known as PM2.5, is small enough to enter the bloodstream and cause serious health problems. According to global environmental health reports, millions of premature deaths each year are linked to poor air quality, making air pollution one of the leading environmental risks worldwide. While major cities in developing regions often experience the highest sustained pollution levels, remote areas can also be choked by smoke from seasonal wildfires and agricultural burning.
AQI Levels Explained
Air quality is measured using the Air Quality Index (AQI), which standardizes different pollutants into a single scale.
| Level | AQI Range | Health Implication |
|---|---|---|
| Good | 0 – 50 | Air quality is satisfactory and poses little or no risk. |
| Moderate | 51 – 100 | Acceptable; sensitive individuals may experience minor irritation. |
| Unhealthy for Sensitive Groups | 101 – 150 | Members of sensitive groups may experience health effects. |
| Unhealthy | 151 – 200 | Everyone may begin to experience health effects. |
| Very Unhealthy | 201 – 300 | Health alert: everyone may experience more serious health effects. |
| Hazardous | 300+ | Health warnings of emergency conditions. Entire population is more likely to be affected. |
Stagnant weather, high pressure systems, and intense heat can trap pollutants near the ground and make air quality worse.
What Causes Poor Air Quality
Human activities cause most severe air pollution episodes, including vehicle emissions, industrial output, coal-fired power plants, and agricultural burning. Natural sources also play a major role. Wildfires release massive amounts of smoke and particulate matter that can travel thousands of kilometers. Dust storms, volcanic ash clouds, and sea salt can also spike particulate levels in various regions around the world.
How Monitoring Stations Work
Air quality data comes from ground-based monitoring networks operated by government agencies such as the U.S. EPA and the European Environment Agency, combined with satellite observations. These stations measure specific pollutants—primarily PM2.5, PM10, nitrogen dioxide, sulfur dioxide, carbon monoxide, and ozone—and update their readings continuously throughout the day. The AQI number reflects the concentration of these pollutants in the air. A low index value indicates clean air, while a high index value indicates heavy pollution and potential health risks. Not every station measures every pollutant simultaneously, and extreme weather or technical maintenance can cause temporary gaps in station reporting. Heavy fog or dense cloud cover can sometimes interfere with satellite-based atmospheric measurements.
What Hazardous Air Quality Means
When air quality reaches hazardous levels, environmental agencies issue severe health warnings. In these conditions, schools may cancel outdoor activities, public transit may offer free rides to reduce vehicle emissions, and residents are advised to stay indoors. Vulnerable populations, including children, the elderly, and people with asthma or heart conditions, are at the highest risk and should strictly avoid outdoor exertion.
Some of the Worst Air Pollution Events in History
- London Smog, United Kingdom, 1952: A period of cold weather combined with windless conditions and coal smoke trapped over the city, causing an estimated 4,000 to 12,000 deaths.
- Southeast Asian Haze, 1997: Widespread slash-and-burn agricultural fires in Indonesia caused severe air pollution across Malaysia, Singapore, and neighboring countries, affecting millions.
- Moscow Wildfires, Russia, 2010: Severe heatwaves and wildfires choked Moscow in thick peat and forest smoke, doubling normal mortality rates during the peak weeks.
- Beijing Airpocalypse, China, 2013: PM2.5 levels soared past 900 micrograms per cubic meter, leading to widespread shutdowns and driving national policy shifts on industrial emissions.
- Australian Black Summer, 2019–2020: Massive bushfire smoke drifted across major cities like Sydney and Canberra, pushing air quality indexes to hazardous, record-breaking levels.
- Canadian Wildfire Smoke, North America, 2023: Unprecedented wildfire smoke traveled south, blanketing New York City and the U.S. East Coast in a dense orange haze that grounded flights and triggered nationwide air quality alerts.
Protecting Yourself on Smoky or Polluted Days
Smoke and fine particles can travel vast distances and penetrate deep into buildings. On high-pollution days, stay indoors with windows and doors closed. Use a HEPA air purifier to clean indoor air, avoid strenuous outdoor exercise, and wear an N95 respirator mask if you must go outside. Check your local air quality index before planning outdoor activities. EarthInformer is an information site and does not issue official health warnings or emergency advisories.
Source: Air quality data aggregated from the World Air Quality Index (WAQI) project and official government monitoring networks.
Air Quality FAQ
AQI is a standardized index value used to describe how clean or polluted the air is, and what associated health effects might be a concern.
The map automatically fetches data from official government monitoring stations and satellites worldwide every 15 minutes.
PM2.5 refers to fine particulate matter that is small enough to penetrate deep into the lungs and enter the bloodstream, posing a serious health risk.
You should stay indoors with windows closed, avoid strenuous outdoor physical exercise, use a HEPA air purifier if available, and wear an N95 mask if you must go outside.
This is often caused by smoke from nearby wildfires, heavy smog, industrial pollution, or dust storms that can be transported across thousands of kilometers.
No, the site is an independent information platform. For acute health threats or official evacuation orders, always follow instructions from local authorities.
The data is gathered from the global World Air Quality Index (WAQI) project and official environmental agencies and monitoring networks worldwide.