
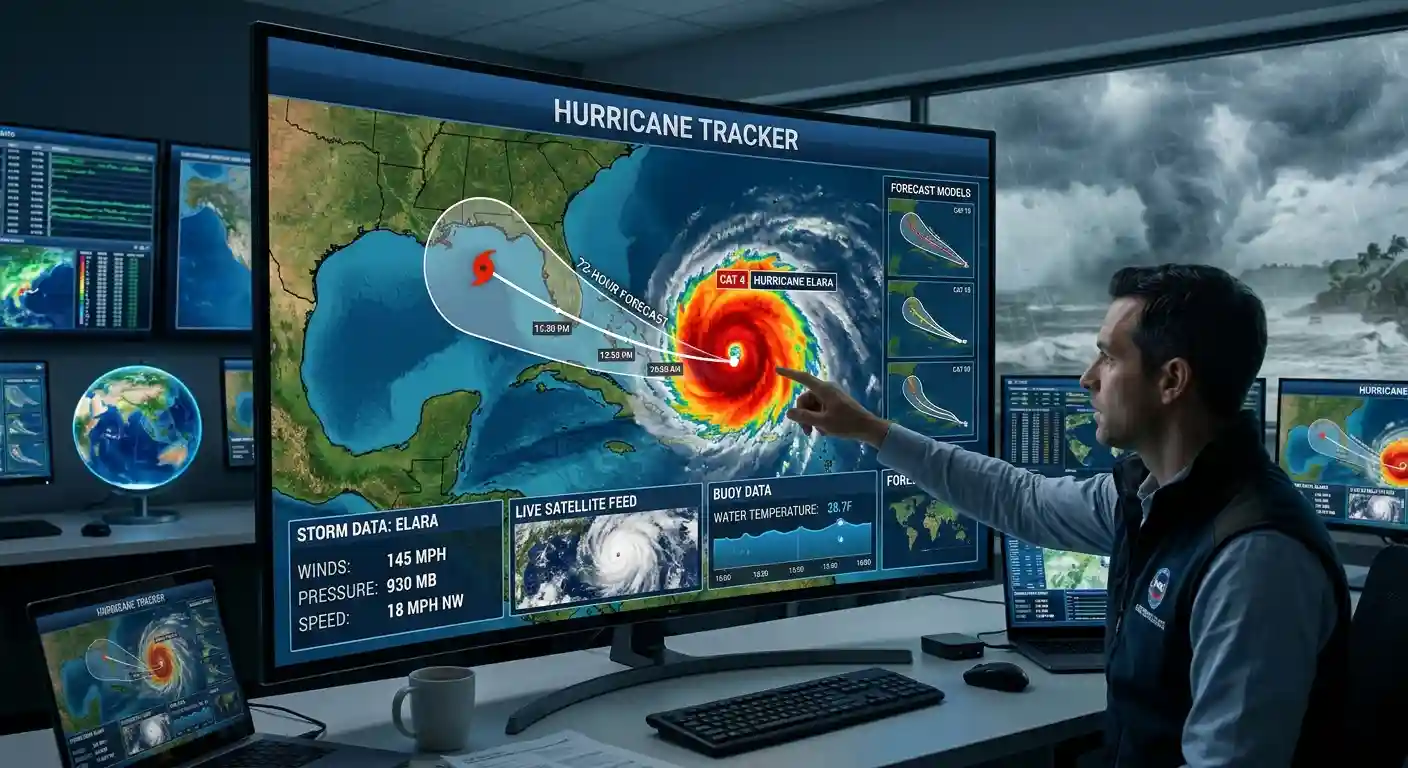
Active hurricanes and tropical storms with forecast tracks and areas to watch, updated every 5 minutes.
Data: NOAA National Hurricane Center and Central Pacific Hurricane Center. Updates automatically every 5 minutes. Wind speeds in mph. For official forecasts and warnings, visit nhc.noaa.gov.
What This Hurricane Tracker Shows
This page shows active hurricanes and tropical storms on a live map. The data comes from the National Hurricane Center (NHC) and the Central Pacific Hurricane Center, and it refreshes every 5 minutes. Each storm is marked with its current position, its forecast track and its forecast cone. The colors show how strong the winds are. Use the buttons to switch between the Atlantic, Eastern Pacific and Central Pacific, or to hide the cone and the 7-day outlook.
Are There Any Hurricanes Right Now?
Check the list next to the map. If a storm is active, it shows the name, wind speed in mph, pressure and direction of movement. If the list says there are no active storms, the NHC is not issuing advisories at the moment. The map also shows “areas to watch”, which are zones where the NHC sees a chance of a new storm forming in the next 7 days.
Hurricane Season Dates
The Atlantic hurricane season runs from June 1 to November 30. The Eastern Pacific season starts earlier, on May 15. Most storms form in late summer, and activity peaks around September 10. Storms outside the season are rare, but they do happen.
How Many Hurricanes Happen Each Year
In an average Atlantic season, about 14 named storms form. Of those, around 7 become hurricanes and 3 become major hurricanes (Category 3 or higher). Some years are far from average:
- 2005: 28 named storms, including 15 hurricanes. It included Katrina, Rita and Wilma.
- 2020: 30 named storms, the most ever recorded in the Atlantic. The list of names ran out, and forecasters had to use the Greek alphabet.
Hurricane Categories
A storm becomes a tropical storm at 39 mph and a hurricane at 74 mph. Hurricanes are rated from 1 to 5 on the Saffir-Simpson scale, based on sustained wind speed.
- Tropical depression: under 39 mph
- Tropical storm: 39 to 73 mph
- Category 1: 74 to 95 mph
- Category 2: 96 to 110 mph
- Category 3: 111 to 129 mph
- Category 4: 130 to 156 mph
- Category 5: 157 mph or higher
The category only describes wind. Many of the deadliest storms were killed by water, not wind, through storm surge and rainfall flooding.
How to Read the Forecast Cone
The cone shows the probable path of the center of the storm. The center is expected to stay inside the cone about two thirds of the time. It does not show how big the storm is, and dangerous weather often spreads far outside the cone. Rain, wind and surge can hit areas that are not inside it.
Major Storms in Recent History
- Galveston, 1900: A hurricane killed an estimated 8,000 people in Texas. It remains the deadliest natural disaster in U.S. history.
- Katrina, 2005: More than 1,300 deaths and about $125 billion in damage, mostly from flooding in New Orleans after the levees failed.
- Harvey, 2017: Parts of Texas received more than 60 inches of rain, and damage reached about $125 billion.
- Ian, 2022: A Category 4 hurricane that hit Florida with 150 mph winds. It caused more than 150 deaths and about $113 billion in damage.
- Helene, 2024: A Category 4 landfall in Florida’s Big Bend. More than 200 people died across the Southeast, many from flooding far inland.
How Hurricanes Get Their Names
Storm names come from lists maintained by the World Meteorological Organization. There are six lists for the Atlantic, and they rotate every six years. When a storm is especially deadly or costly, its name is retired. Katrina, Harvey and Ian are all retired names.
What to Do If a Hurricane Is Coming
Follow your local emergency officials, and know your evacuation zone before the season starts. Prepare supplies for at least three days, including water, food, medicine and a charged phone. Do not wait for the storm to reach the coast, because roads can fill up and close quickly. EarthInformer is an information site and does not issue official warnings. Always follow instructions from local authorities.
Source: All storm data on this page comes from the National Hurricane Center (NHC) and the Central Pacific Hurricane Center.
Check the list next to the map above. It shows every active hurricane and tropical storm from the National Hurricane Center, updated every 5 minutes. If the list is empty, there are no active storms at the moment, but the map still shows areas the NHC is watching for possible development.
The Atlantic hurricane season runs from June 1 to November 30, with the peak around September 10. The Eastern Pacific season runs from May 15 to November 30.
An average Atlantic season has about 14 named storms, 7 hurricanes and 3 major hurricanes. The record is 30 named storms, set in 2020.
It depends on wind speed. A tropical depression has winds under 39 mph, a tropical storm has 39 to 73 mph, and a hurricane has 74 mph or more.
Hurricanes are rated 1 to 5 on the Saffir-Simpson scale. Category 1 is 74 to 95 mph, Category 2 is 96 to 110 mph, Category 3 is 111 to 129 mph, Category 4 is 130 to 156 mph, and Category 5 is 157 mph or higher. Category 3 and above are called major hurricanes.
The cone shows the probable path of the center of the storm. The center stays inside it about two thirds of the time. It does not show the size of the storm, so wind, rain and flooding can reach areas outside the cone.
Names come from six rotating lists kept by the World Meteorological Organization. A name is retired if the storm was very deadly or costly, like Katrina in 2005 or Ian in 2022.